The Basics: Why is my Wi-fi so slow and how do I fix it
Understanding RSSI
RSSI stands for Received Signal Strength Indicator, and measures how well a client device can hear (receive) a signal. Learn how to understand the index and how it’s used in measuring the strength of your Wi-Fi signal.
Basic W-Fi Lessons
What is RSSI and what does it mean for a Wi-Fi network?
RSSI, or “Received Signal Strength Indicator,” is a measurement of how well your device can hear a signal from an access point or router. It’s a value that is useful for determining if you have enough signal to get a good wireless connection. Note: Because an RSSI value is pulled from the client device’s Wi-Fi card (hence “received” signal strength), it is not the same as transmit power from a router or AP.
Get Reliable Wi-Fi at Home
For professionals working from home, students studying from home, and teachers teaching from home, reliable home Wi-Fi is part of what we need to get through our day.
Signifi Personal tells you what’s wrong and helps you make it right.

RSSI vs dBm
dBm and RSSI are different units of measurement that both represent the same thing: signal strength. The difference is that RSSI is a relative index, while dBm is an absolute number representing power levels in mW (milliwatts).
RSSI is a term used to measure the relative quality of a received signal to a client device, but has no absolute value. The IEEE 802.11 standard (a big book of documentation for manufacturing Wi-Fi equipment) specifies that RSSI can be on a scale of 0 to up to 255 and that each chipset manufacturer can define their own “RSSI_Max” value. Cisco, for example, uses a 0-100 scale, while Atheros uses 0-60. It’s all up to the manufacturer (which is why RSSI is a relative index), but you can infer that the higher the RSSI value is, the better the signal is.
Since RSSI varies greatly between chipset manufacturers, MetaGeek software uses a more standardized, absolute measure of signal strength: received signal power, which is measured in decibels, or dBm on a logarithmic scale. There’s a lot of math we could get into, but basically, the closer to 0 dBm, the better the signal is.
To help leverage your signal strength measurement most effectively so you can make channel planning decisions, inSSIDer displays signal strength in two ways.
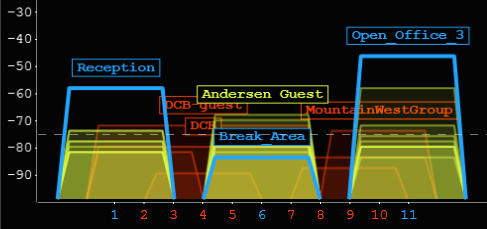
The Networks Table visualizes where selected networks are located on the 2.4 or 5 GHz band in relation to other networks, and the signal strengths of each.

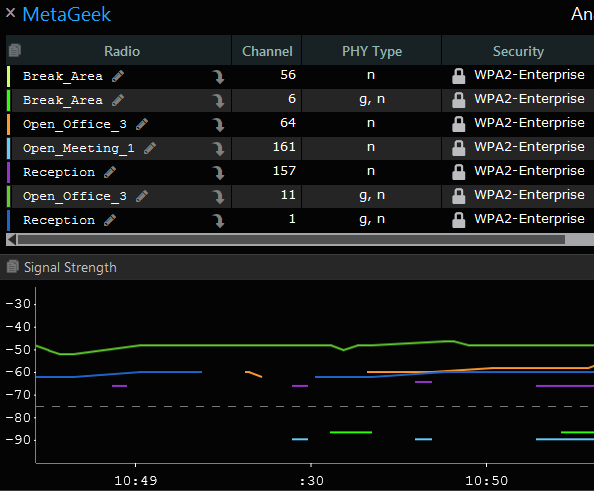
The Signal Strength Over Time graph shows how your network’s signal strengths changes as you move around the room or office.

Acceptable Signal Strengths
| Signal Strength | TL;DR | Required for | |
|---|---|---|---|
| -30 dBm | Amazing | Max achievable signal strength. The client can only be a few feet from the AP to achieve this. Not typical or desirable in the real world. | N/A |
| -67 dBm | Very Good | Minimum signal strength for applications that require very reliable, timely delivery of data packets. | VoIP/VoWi-Fi, streaming video |
| -70 dBm | Okay | Minimum signal strength for reliable packet delivery. | Email, web |
| -80 dBm | Not Good | Minimum signal strength for basic connectivity. Packet delivery may be unreliable. | N/A |
| -90 dBm | Unusable | Approaching or drowning in the noise floor. Any functionality is highly unlikely. | N/A |
What if I have an acceptable signal strength but I’m still having problems?
If you’ve already checked your signal strength using a Wi-Fi scanning app like inSSIDer and concluded that you have acceptable Wi-Fi signal strength, then interference may be to blame. Your computer’s Wi-Fi adapter can help you see some types of interference, but for finding non-Wi-Fi interferers, you’ll need a spectrum analysis tool like Wi-Spy.
The signal strength of the “MetaGeek” SSID is great (approx. -50dBm), but the actual wireless signal is being destroyed by a non-Wi-Fi interferer, which is shown above with a large green spiky shape between channels 5 and 6.
